Jobs via Web Interface
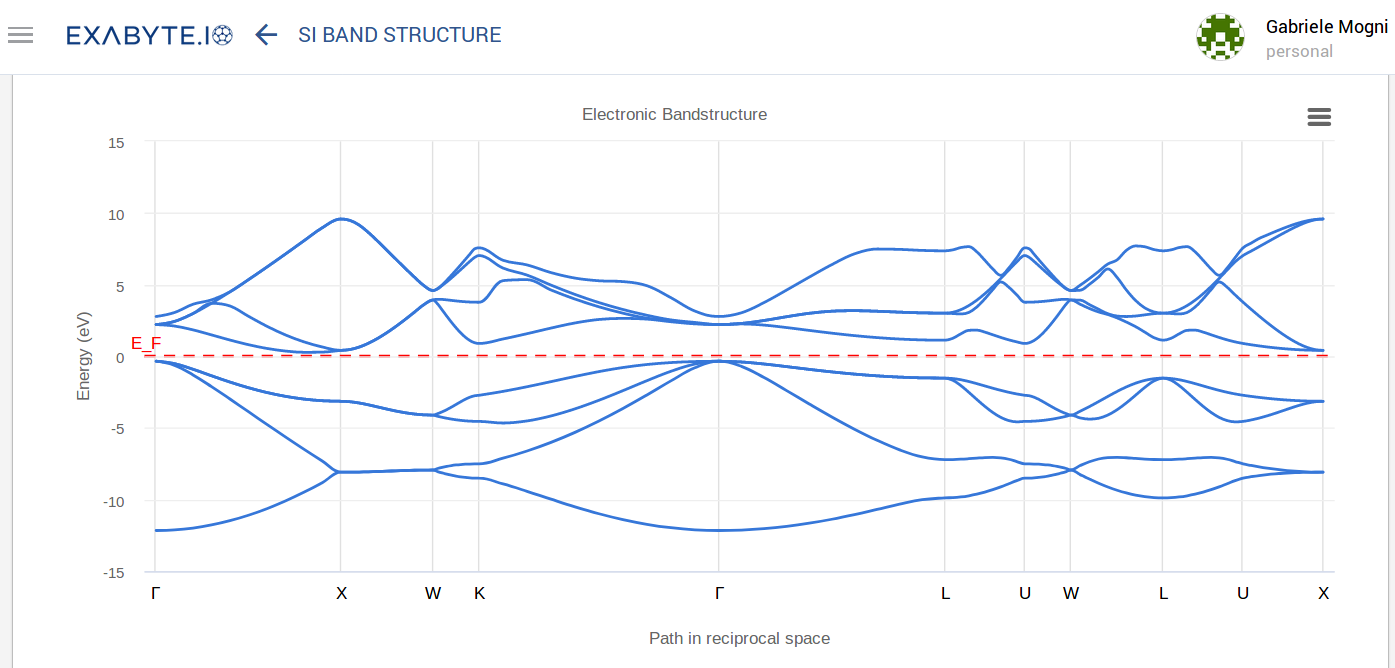
This page explains how to run a simple density functional theory calculation to obtain an electronic band structure via our main Web Interface.
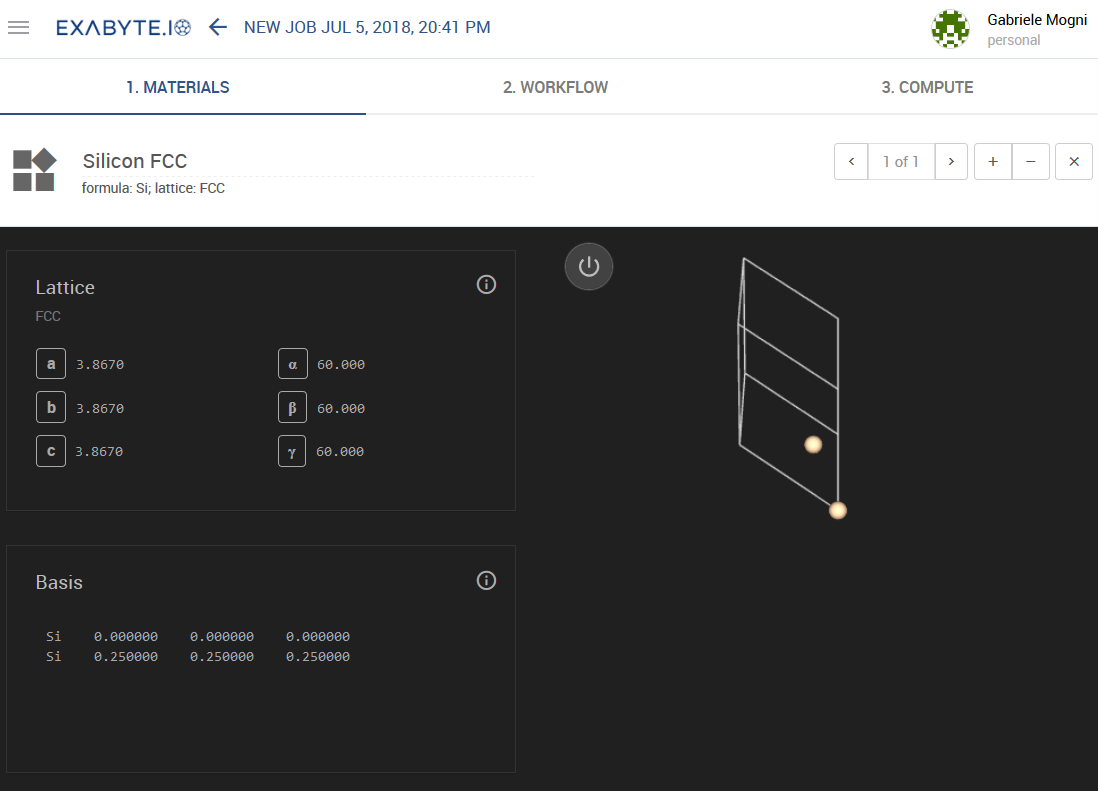
Each account is pre-configured with one default material and workflow. For the sake of this tutorial, we will keep the default parameters at each step. We will thus study silicon in the standard face-centered cubic structure and use Quantum ESPRESSO as the simulation engine.
Prepare Material and Workflow
Users may also add new materials or workflows into their collection from the application-wise "Bank" collection that we maintain. To do so, select the "Bank" option in the left-hand sidebar of the user interface, and then "Materials" or "Workflows" as the user prefers. To import either workflows and material structures from the Bank, select the desired entry and then click "Copy" in the top-right taskbar of the page, as explained in more detail here.
Silicon FCC is the default material added to each account on creation. In the animation below we demonstrate how to import the "Band Structure" workflow for Quantum ESPRESSO from the Bank.
Readers can also learn how to create or upload / import materials with the aid of the incorporated Exabyte Materials Designer tool, as well as further setting them as default elsewhere in this documentation.
Open Job Designer
Start by clicking "Create Job" link in the left-hand sidebar to open the "Job Designer" page, where the user can do the following actions via the relevant Tab for each.
- Choose a previously created material
- Choose and adjust a simulation Workflow
- Setup compute parameters
1. Materials Tab
Materials Tab lets the user choose one or more previously imported materials for use during the calculation. We will proceed with the default structure of Silicon.

2. Workflow Tab
Simulations usually have multiple steps that need to be executed in a certain order. This step sequence is called a "Workflow".
Open the dropdown menu of the top-level page header (see animation below), click "Select Workflow" and select "Bandstructure" workflow with "espresso" as modeling engine, after searching for the corresponding keywords in the resulting "Select Workflow" dialog. We divide a workflow into "Subworkflows", such that each individual Subworkflow can only contain one modeling engine and one theoretical model (eg. Quantum ESPRESSO, or "espresso", and density functional theory respectively).
The subworkflow "Overview" tab contains the basis information about it, including the individual computational building blocks - or "Units". Settings that we classify as most important are listed under "Important Settings": k-point grid and k-point path within the reciprocal space of the crystal are among them for the case of a "Band Structure" calculation considered here.
One can further modify the input files for each individual part of the subworkflow by clicking on the corresponding unit, and adjusting its input content as the animation below demonstrates.
3. Compute Tab
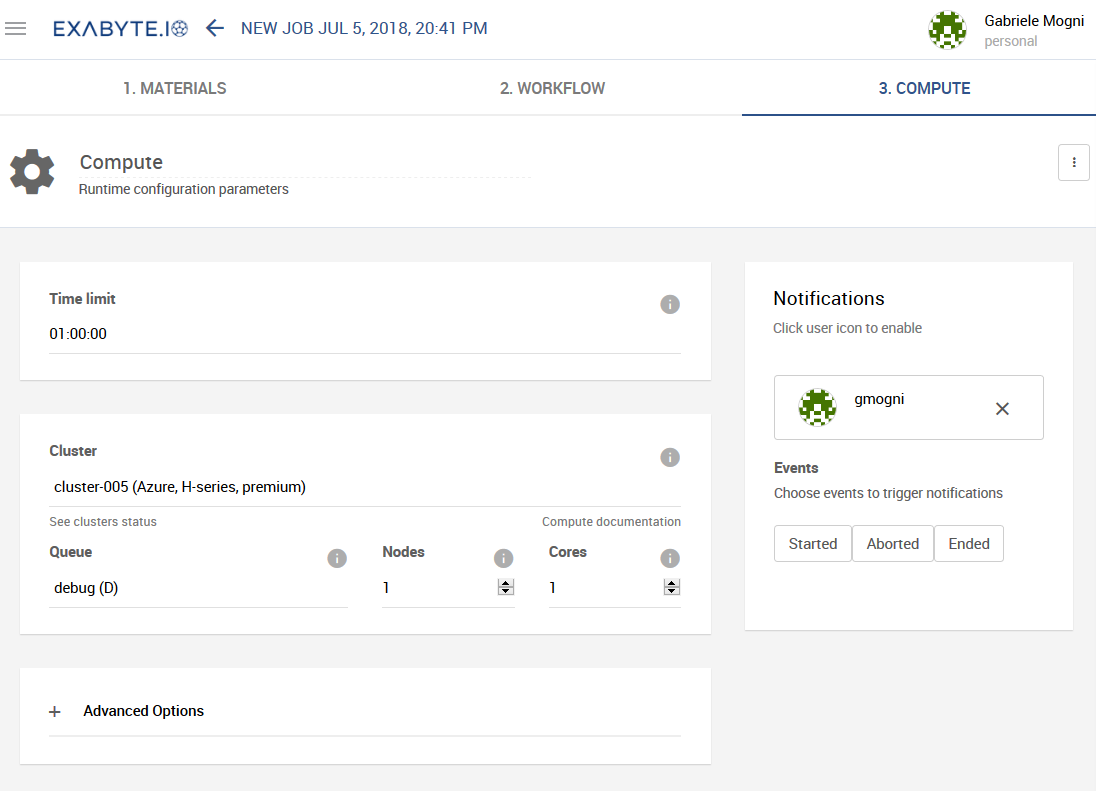
The "Compute" tab lets the user set up the number of processor cores to be used for the computation, its maximum time limit and other relevant compute parameters. We set the maximum time limit for the calculation to properly schedule the allocation of resources. The format is HH:MM:SS, so that 01:00:00 corresponds to up to 1 hour runtime.
One can also choose to be notified of the job status by clicking on his/her name in the "Notifications" section.
For the moment, let us leave all parameters at their default values and click "Save".

Summary
We have just finished creating our first job. We can now proceed to submit it.
Run Calculation
After saving the job, the user is redirected back to the default "Project" page. Here, the user can submit the job and track its status.
Submit and Track Progress
The user can run the job by clicking the three vertical dots to the right of its status label ("pre-submission"), and choosing "Run", as explained in more detail here.
The status will change from "pre-submission" to "submitted". This means that the job is finally submitted to our computing clusters. Depending on the load, it may take some time for it to become "Active" and thus start executing.
The user can click on the job name to monitor the progress of the job in real time within the Job Viewer Interface.
View Results and Access Files
The Job Viewer screen tracks the input parameters, output text, and convergence parameters involved in the computation (total energy in this tutorial). It also allows the user to view the results of the calculation, and to download output files when finished.
Done
We have demonstrated in the present page how a simple electronic band structure calculation can be run using exabyte.io. For a more comprehensive tutorial, readers may refer to the dedicated "Tutorials" section of our documentation.
