User Dashboard
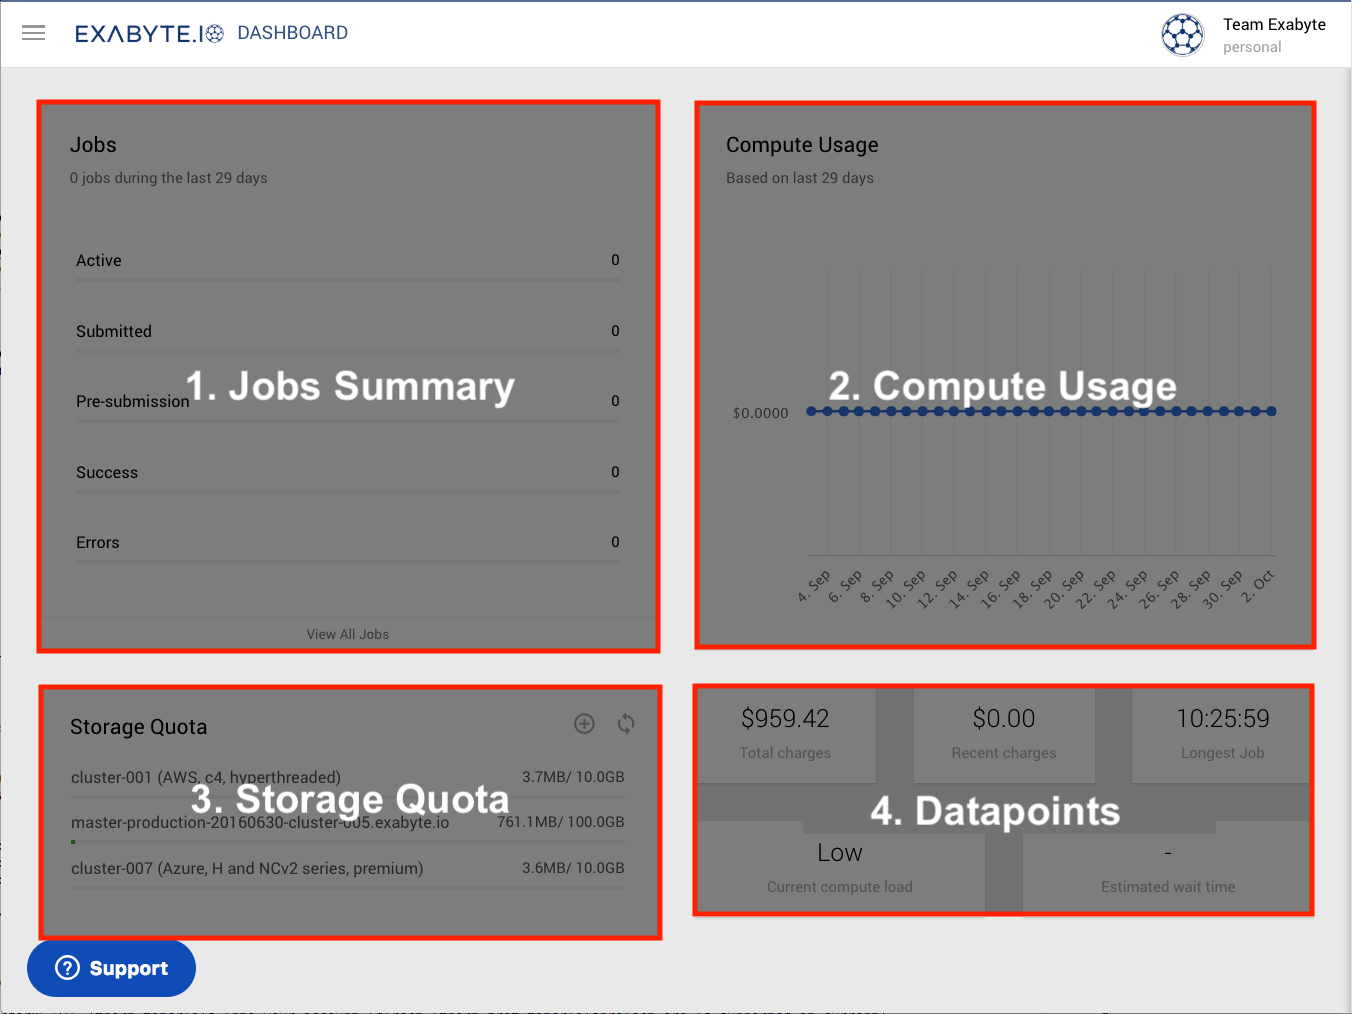
The Dashboard page provides the user with an instant snapshot of the system status, and of his/her own recent work. Four main component panels can be recognized, as shown below.

1. Jobs summary
The "Jobs Summary" panel summarizes the total number of jobs run during a certain period of time, as indicated at the top of the panel. It also offers a break down of the job's current status between "Active", "Submitted", "Pre-submission", "Success" and "Errors". There is finally a quick link to jump to the jobs list at the bottom of the panel, labelled "View All Jobs".
2. Compute Usage
The "Compute Usage" chart shows the combined financial cost for recent calculations, over the given duration of time.
3. Storage Quota
This widget displays a summary of the user's current storage quota, in the form of the ratio between used and total available storage space. The user can click the icon at the top-right corner of the panel to request an increase in storage space. In addition, the neighbouring icon can be used to refresh the data.
4. Datapoints
| Datapoint | Description |
|---|---|
| Total charges | Shows a summary of the total charges over all time |
| Recent charges | Shows charges of last week |
| Longest Job | Shows compute walltime of the longest job ever performed by the user |
| Current Compute Load | Shows current server compute load (low/medium/high) |
| Estimated Wait Time | Shows an estimated wait time for newly submitted jobs |