Electronic Density of States
Non-Scalar Electronic
The Density of States of the material describes the number of states per an interval of energy at each energy level available to be occupied 1.
Example
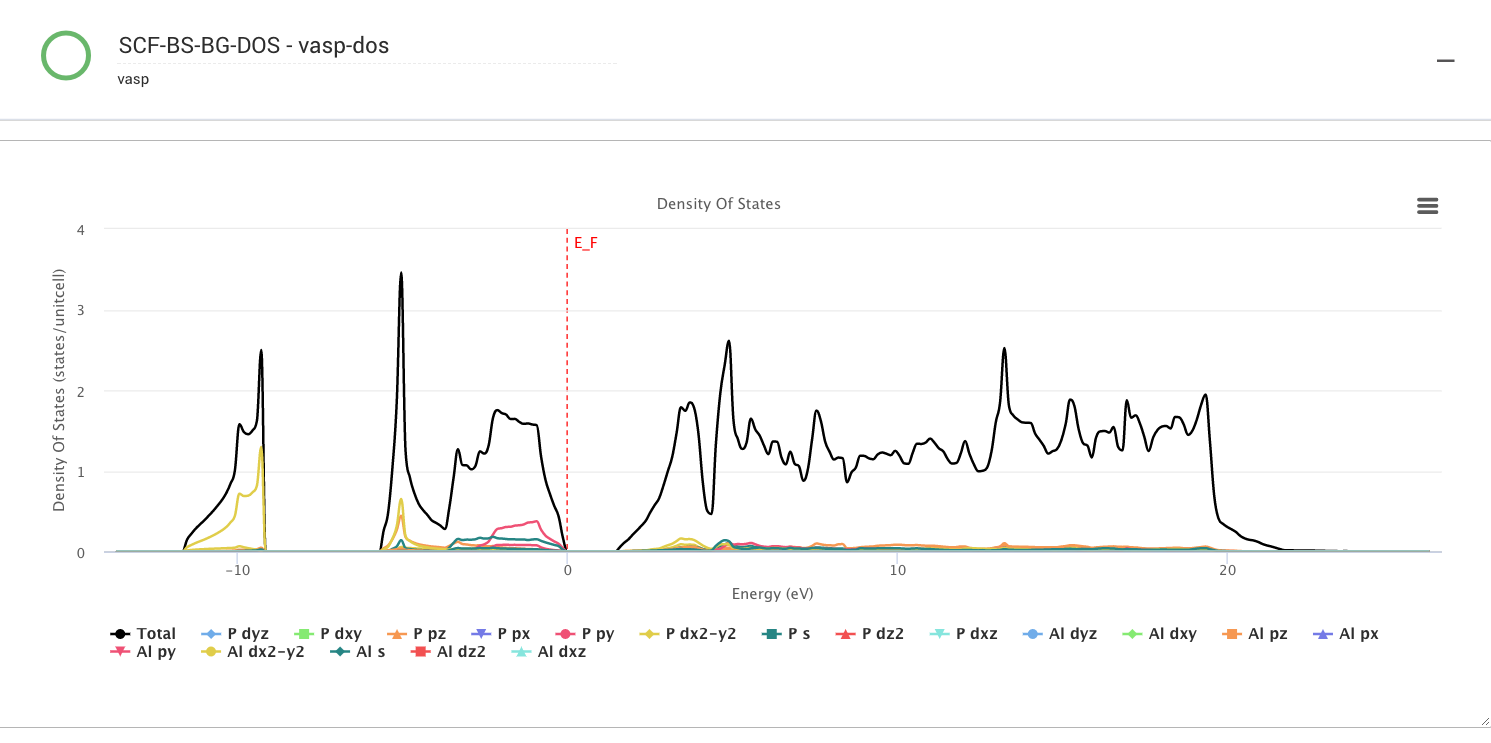
Example results for the computed electronic Density of States are also presented graphically in the Results Tab of Job Viewer.
The typical appearance of such a Density of States plot for electronic bandstructures is shown below.

Notation
In this graph, the total density of states is marked by the black line. Individual contributions are labelled with different colors, as explained in the legend below the graph. The Fermi level is set by the vertical red dashed line.
Export as Image
The possibility to export the graph is offered as mentioned here.
Schema
The JSON schema and an example representation for this property can be found here.