Reaction Energy Profile
Non-Scalar Chemical
Any chemical reaction or process can be characterized by its Reaction Energy Profile 1. This profile is a theoretical representation of the reaction's energetic pathway, followed by the reactants as they are transformed into products during the course of the reaction. It is typically plotted along the main reaction coordinate, a parametric curve that follows the pathway of a reaction, and that indicates its overall progress.
The purpose of energy profiles is to provide a qualitative representation of how potential energy varies with molecular motion for a given chemical reaction.
Example
Reaction Energy Profile calculations can be performed with an appropriate Workflow, based on the Nudged Elastic Bands method such as implemented by the Quantum ESPRESSO modeling application.
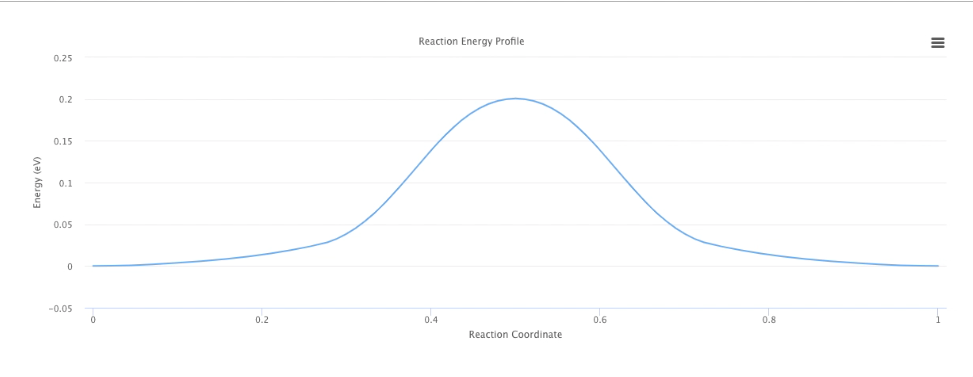
The final results are portrayed in the Results Tab of Job Viewer in the form of a profile curve, as illustrated in the graphic below. The visual contains the reaction energy profile for a chemical reaction with activation energy barrier of approximately 0.2 eV.

Export as Image
The possibility to export the graph is offered as mentioned here.
Transition State
The highest potential energy molecular configuration across a reaction energy profile is often referred to as the transition state 2 for the chemical reaction under investigation.
In this section, we explain how the transition state of a chemical reaction investigated with the NEB method can be inspected, both in its original and fully relaxed final molecular configurations, via our user interface at the end of the NEB job execution.
Schema
The JSON schema and an example representation for this property can be found here.