Nudged Elastic Band (NEB) Method
A detailed theoretical review of the NEB method can be found in Ref. 1. A brief introductory explanation is offered in what follows.
The Challenge: Predicting the Minimum Energy Path in Chemical Reactions
In the context of the present introduction, it suffices to know that NEB aims at tackling a common and important problem in theoretical chemistry and in condensed matter physics, consisting in the the identification of the lowest energy path for a transition/rearrangement of a group of atoms from one stable configuration to another. Such transitions may be encountered for example during the course of chemical reactions, changes in conformation of molecules, or diffusion processes in solids.
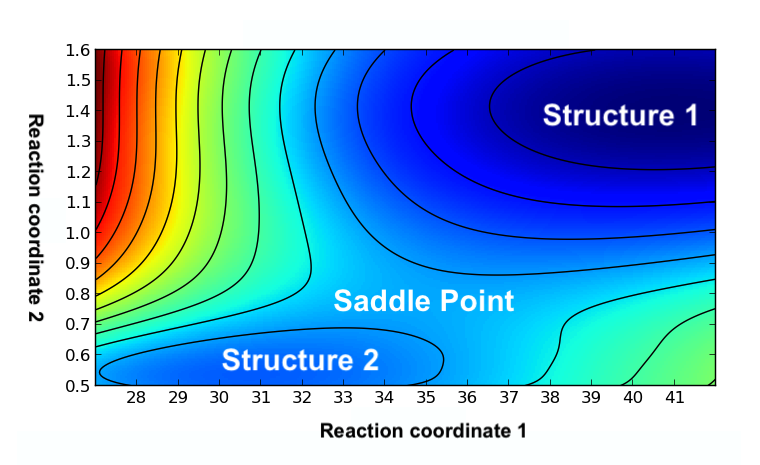
Such a transition path is often referred to as the "minimum energy path" (MEP). The potential energy maximum along the MEP is the saddle point energy which gives the activation energy barrier, a quantity of crucial importance for estimating the transition rate of the reaction.
An example of a two-dimensional energy surface landscape for a generic transition between two structures, corresponding to two local energy minima, is shown in the image below. The position of the intermediate saddle in the energy is also highlighted.

The Nudged Elastic Bands Method
Many different methods, including NEB, have been proposed for finding minimum energy reaction paths and saddle points between known reactants and products. The NEB method works by optimizing a number of intermediate images along the reaction path. Each image finds the lowest energy possible, while maintaining equal spacing to neighboring images. This constrained optimization is done by adding spring forces along the band between images, and by projecting out the component of the force due to the potential perpendicular to the band.
Climbing Image
The computational efficiency of the NEB method can be further improved through the adoption of the Climbing Image approach 2, which allows for a more accurate finding of saddle points using the NEB with fewer images than the original method.
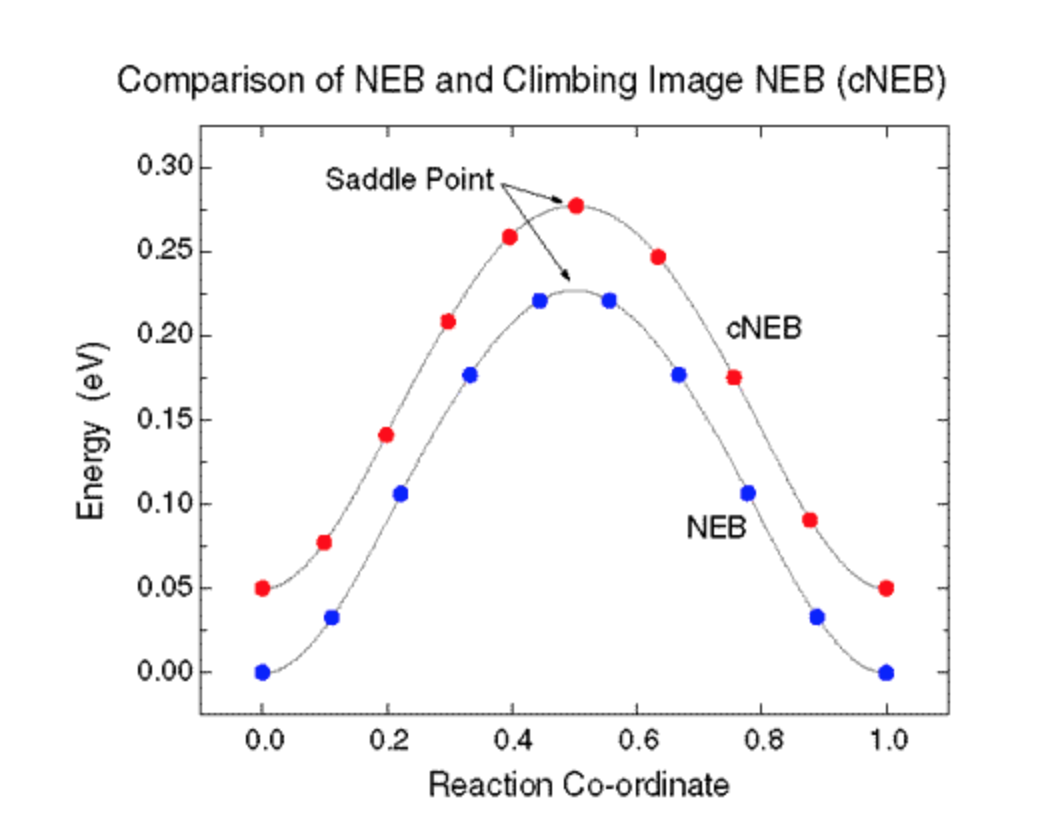
In the climbing image modification, the highest energy image is driven up to the saddle point. This image does not feel the spring forces along the band. Instead, the true force at this image along the tangent is inverted. In this way, the image tries to maximize its energy along the band, and minimize it in all other directions. When this image converges, it will be at the exact saddle point.
Example
The graph below shows a traditional NEB calculation (blue) and a climbing image cNEB calculation (red). The cNEB energies have been shifted by 0.05 eV so that the two curves are distinct. Notice how the climbing image calculation has shifted the position of the images (by compressing the images on the left of the plot), so that one image sits right at the saddle point.

Links
-
H. Jonsson, G. Mills and K.W. Jacobsen: "Nudged elastic band method for finding minimum energy paths of transitions", Document ↩
-
Henkelman, Uberuaga, and Jónsson: "A climbing image nudged elastic band method for finding saddle points and minimum energy paths"; J. Chem. Phys., Vol. 113, No. 22, 8 December 2000 ↩